


Adding Armor To The Investing Arsenal !!!
FA + TA = Swiss Army knife for investing

You have probably heard about Fundamental Analysis (Sector Tailwinds,Valuations,Balance Sheet,Cash Flow etc) and Technical Analysis ( Trends, Stages, Chart Pattern, Volume etc). For years, these two camps have been arguing with each side claiming theirs is the only way to go. I used to be firmly in the "fundamentals only" camp myself thinking technical analysis was just fancy line drawing.
A few years ago, I decided to dive into technical analysis and put it to the test.
I set up two separate portfolios : one with strong fundamental-backed companies and another with stocks showing promising technical chart patterns. This was right at the start of the Covid rebound, so almost everything was going up !!!
What I saw next was fascinating, my fundamental backed portfolio grew steadily with less drama & letting me hold onto stocks longer. But my Technical patterns backed portfolio - It was on FIRE !!! I was able to hold multiple "multibaggers" but it also came with a lot of ups and downs which sometimes made me sell too early.
After about a year and half of this high-flying market, my technical portfolio was significantly outperforming my fundamental one. Over the time, I became a fan of technical analysis - it really works.
Then, the market shifted. We hit a period of correction and consolidation. During this time, the strong fundamental stocks held their ground. While many of the "breakout" technical plays started to fizzle. When I compared my portfolios again, my fundamental portfolio was ahead in this period!
So, what was the big takeaway ? It is not about one being better than the other. Both Fundamental Analysis and Technical Analysis works and they can outperform each other at different times.
That's why, from early 2023, I have been combining both approaches in my Long Term portfolio & Satellite/Positional Portfolio. This blend of both Fundamental & Technical analysis has helped me to manage risk better and generate bigger returns.
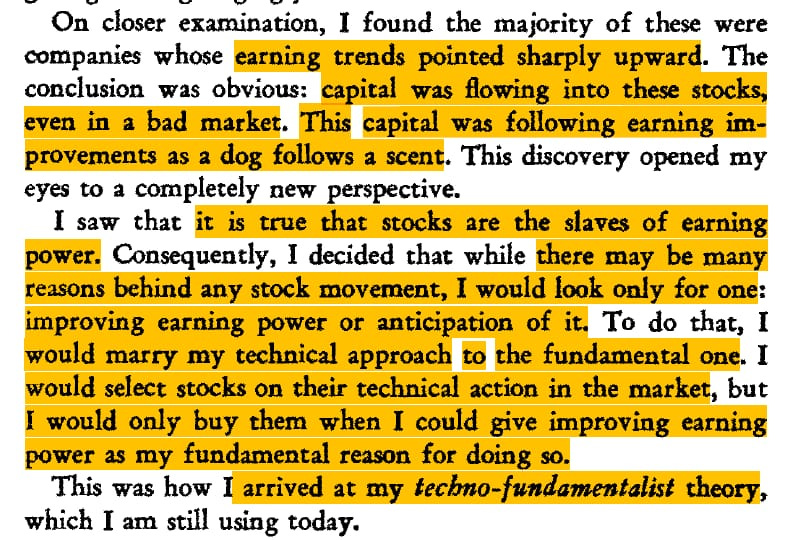
Image Source: How I Made $2,000,000 in the Stock Market book by Nicolas Darvas
Instead of picking a side, why not use the best of both world? It is like having two powerful tools in your investing toolbox, ready for any market condition !!!
3 Big Questions Of Investing :
Whenever we think about investing, three key questions pop up:
What should I buy?
When should I buy it?
When should I sell it?
The answers depend on your investing style and time horizon but Let’s break it down using both Fundamental and Technical Analysis.
Fundamental Analysis : WHAT TO BUY ?
After reading multiple books, watching multiple interviews & SOIC videos, one thing which I have observed is - There is pattern for buying right.
Most of the times, Stocks where people make good money are from the sector going through tailwinds / Something is changing across the sector / Some Rate Of Change happening in the business.
I try to observe below pattern in stocks whenever I am planning to buy something -
Sector Tailwind + Rate Of Change / Fundamental Catalyst which will drive Rerating in future + Reasonable Starting Valuation = WHAT TO BUY ?
Technical Analysis : WHEN TO BUY & WHEN TO SELL ?
We all have limited capital and every decision we make has opportunity cost involved around it. To optimize & make most of the capital available, technical analysis can help us immensely.
When To Buy -
Sector Tailwinds, Good Management, medium to high growth & Reasonable starting valuation should be first criteria so that you can give stock chance to witness Earning Growth + PE Rerating after that we can use Technical analysis to find better entry points using Support Levels / Simple Horizontal line / bullish chart patterns like Cup & Handle pattern, Pole & Flag pattern, Inverted H&S pattern, Range breakout pattern, IPO base breakout pattern etc.
Sector Tailwind + Rate Of Change / Fundamental Catalyst which will drive Rerating in future + Reasonable Starting Valuation + Stage 2 + Bullish Chart Pattern with Volume + Stock above 200 Daily EMA = When To Buy ?
When To Sell -
Most difficult question of investing is when to sell because you will always be wrong in selling but we can optimize the selling using technical analysis but before that watch below video about When To Sell A Stock ?
Fundamentally, We can gauge Overvaluation using various factors like PE, PEG, P/B, Stock trading at unsustainable valuations, Margins Peaking out etc but still sometimes Stock can remain into overvalued territory & Madness of crowd can take stock prices higher & higher. We can use Technical analysis to make most of this rally & also, exit accordingly.
Let's Consider two scenarios:
Bull market :
In a bull market, Crowd madness can push valuations anywhere.
If you have entered reasonably valued stocks that are now overvalued because of euphoria, it is Good to book some profits on the basis of fundamental view. For the remaining position, Just ride the euphoria by setting VSTOP (2) alert and 30 Weekly EMA alerts.
As most rerating is anyway done from fundamental point of view. if you get VSTOP(2) & Below 30 WEMA alerts then simply exit.
If the stock is really strong, it will likely to comeback above the 30 WEMA & will give you chance to revisit.
Transition from bull to Sideways/Bear market:
By this time, most rerating across sectors and stocks is almost done.
Tighten exit criteria with lesser timeframe Weekly EMA alerts. If stock is not part of your long-term portfolio segment, exit and revisit only when it goes above the 30 WEMA.
No strategy is foolproof in investing and we will fail in different market conditions.
As a investor, our job is to minimize risk & maximize returns. I think, VSTOP(2) & 30 Weekly EMA is perfect combination to ride the winners & cut the losses.
Priced To Perfection (Overvaluation) + Earnings Growth Slowing Down + Stocks started going below 30 Weekly EMA + VSTOP Turned Negative = When to Sell ?
From 2023, I am keeping 2 separate portfolios because both has different thought process behind it.
A) Long Term Portfolio (2-3 Year View) :
a) Higher weightage on Fundamentals & technicals will be mostly used to add more on supports & breakouts.
b) Stocks with 2-3 year view & If everything goes well & business growing well then will expand the horizon on the basis of earnings growth.
c) Stocks with Sector Tailwind + Rate Of Change / Fundamental Catalyst which will drive Rerating in future + Reasonable Starting Valuation + Stage 2
There are 2 sub-segment of this portfolio -
1) Long-term stocks (MegaTrend - 20-30% of PF) :
These stocks are part of long-term megatrends where we are seeing consistent decent earnings growth. In case of bear market, I am ready to take pain of 30-40% fall & ready to add more whenever there is a dip. I keep 20-30% of such stocks where I am ready to take pain for long term gain because you can't play game to make 5x-10x while hoping that you will exit with a 10-20% drawdown.
2) Medium to long-term stocks (Rest of the PF) :
These stocks will also have sector tailwinds,Rate of change, Reasonable starting valuation & strong earnings growth but need monitoring. Here, I set VSTOP & 30 Weekly EMA alert & revisit the thesis whenever it broke down these levels.
B) Satellite / Positional Portfolio (6-12 month View) :
a) Higher weightage on Stage 2 + Technical Chart Patterns & Fundamentals will be to find WHAT TO BUY (Sector Tailwinds, High Growth, Reasonable Valuation) rather than randomly chasing patterns everywhere.
b) Stocks with 3-4 quarters view & If everything goes well with business growing well & then will expand the horizon on the basis of technical strength & breakouts.
If you see in both the portfolios, I try to mix fundamentals & technicals for different purposes & Both are helping me to generate risk adjusted returns in both the portfolio.
Personally, My success ratio got improved because of Mixing Fundamental & Technicals.
Fundamental Analysis Reduces the RISK & Technical Analysis Improves REWARD.
I am sharing few case studies in which FA + TA helped me to find interesting opportunities in the past.
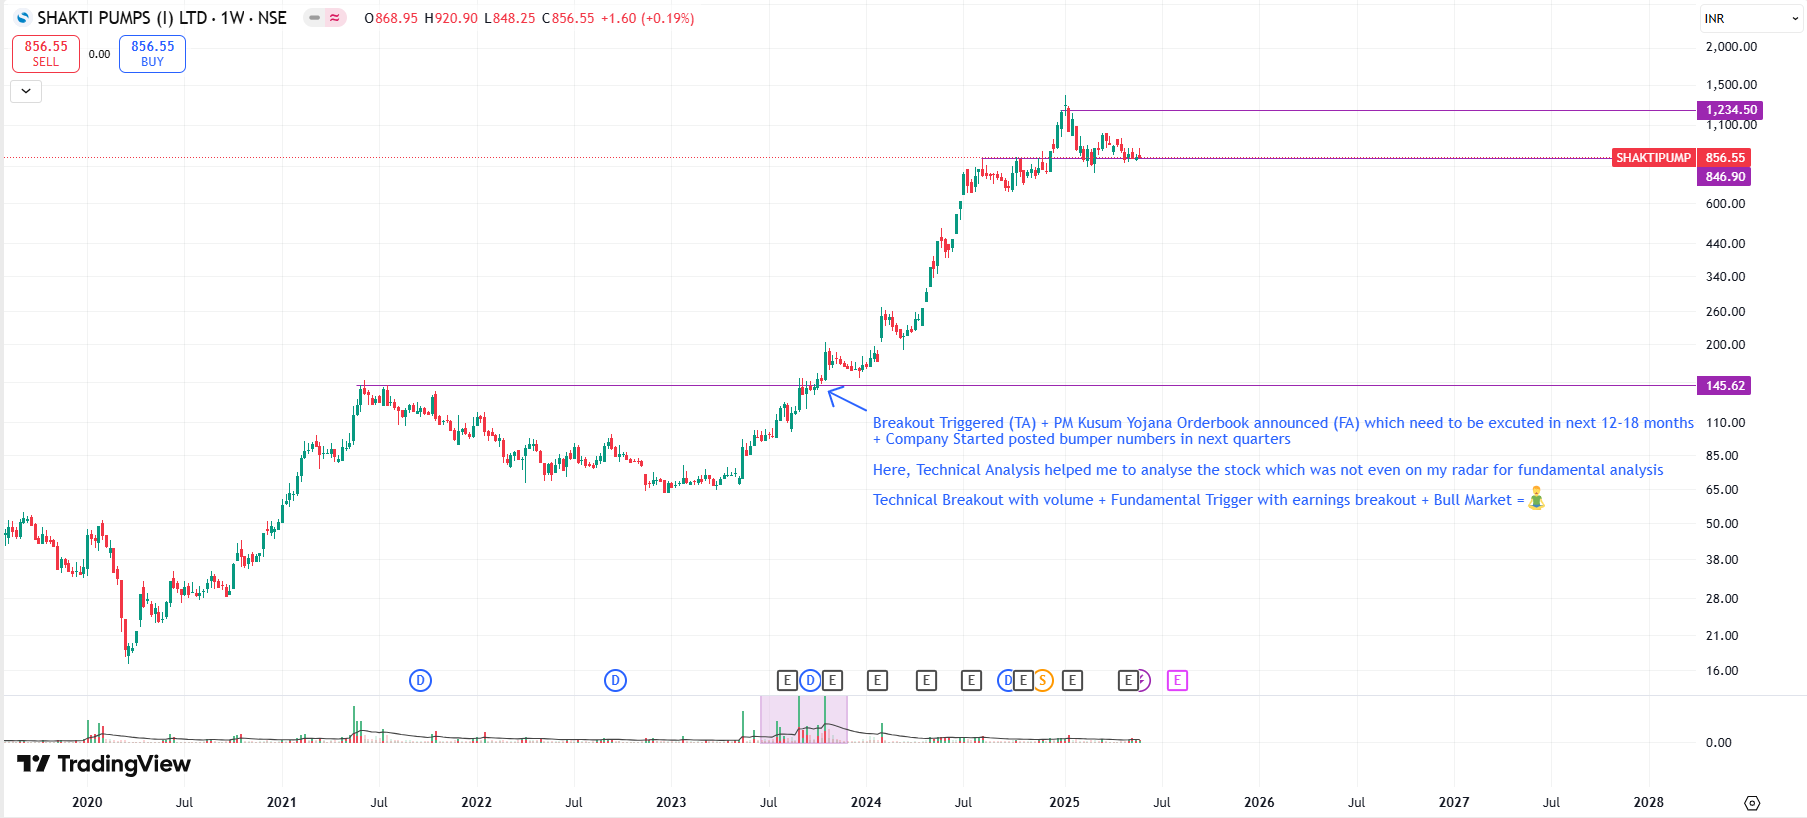
Shakti Pumps :
Prestige Estate :

Nuvama Wealth Management :

Aarti Pharmalabs :

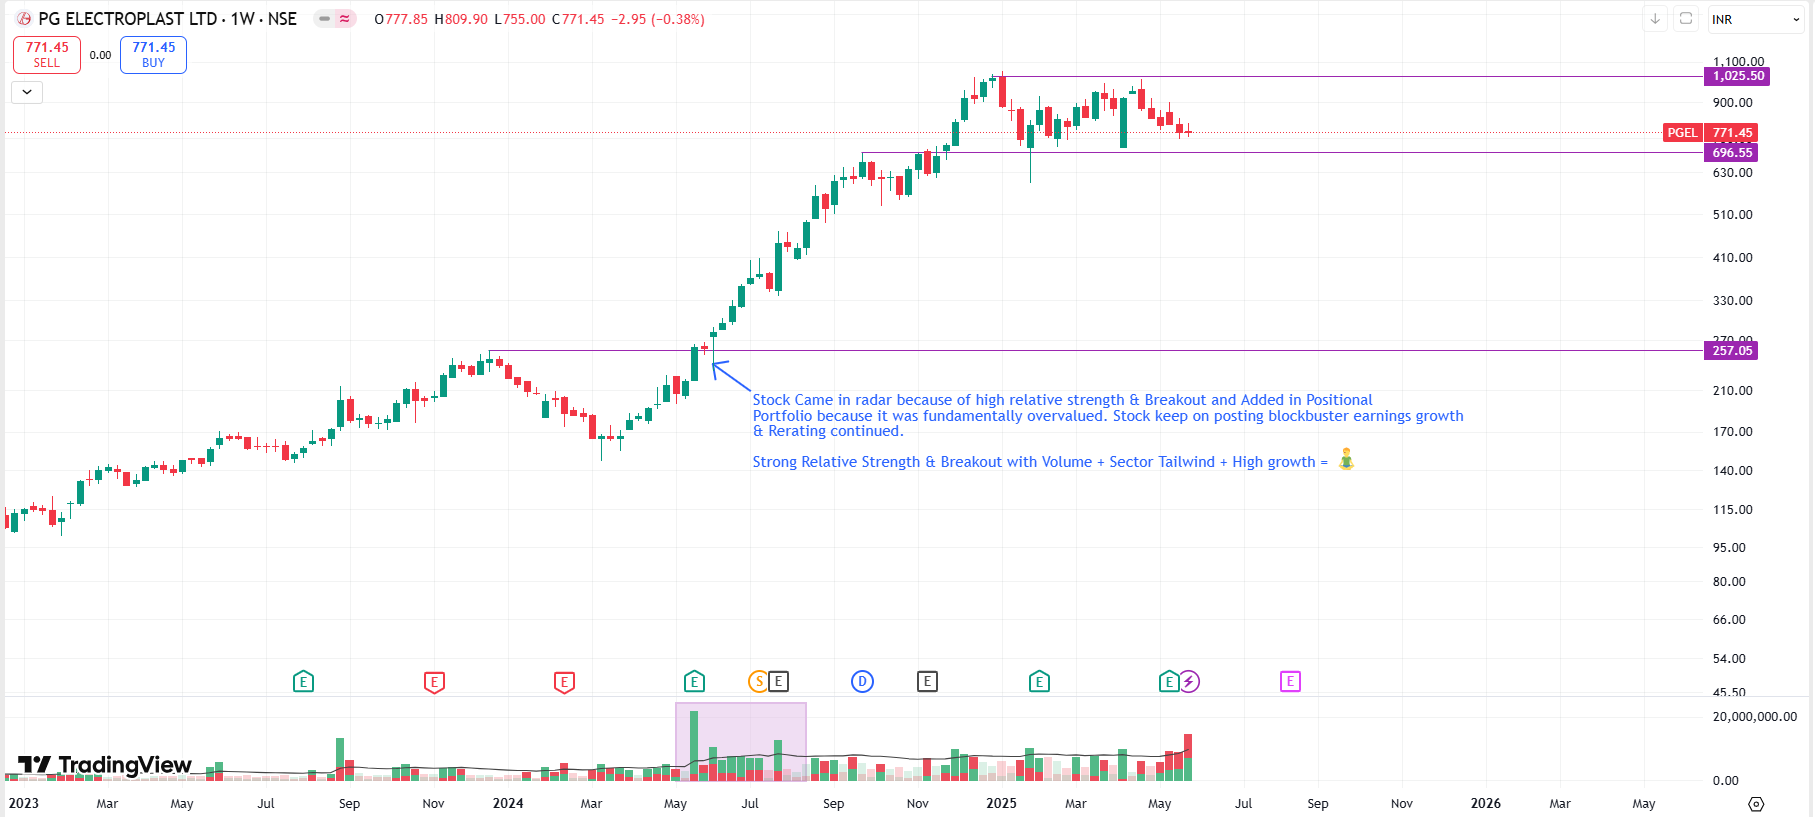
PG Electroplast :
Va Tech Wabag :

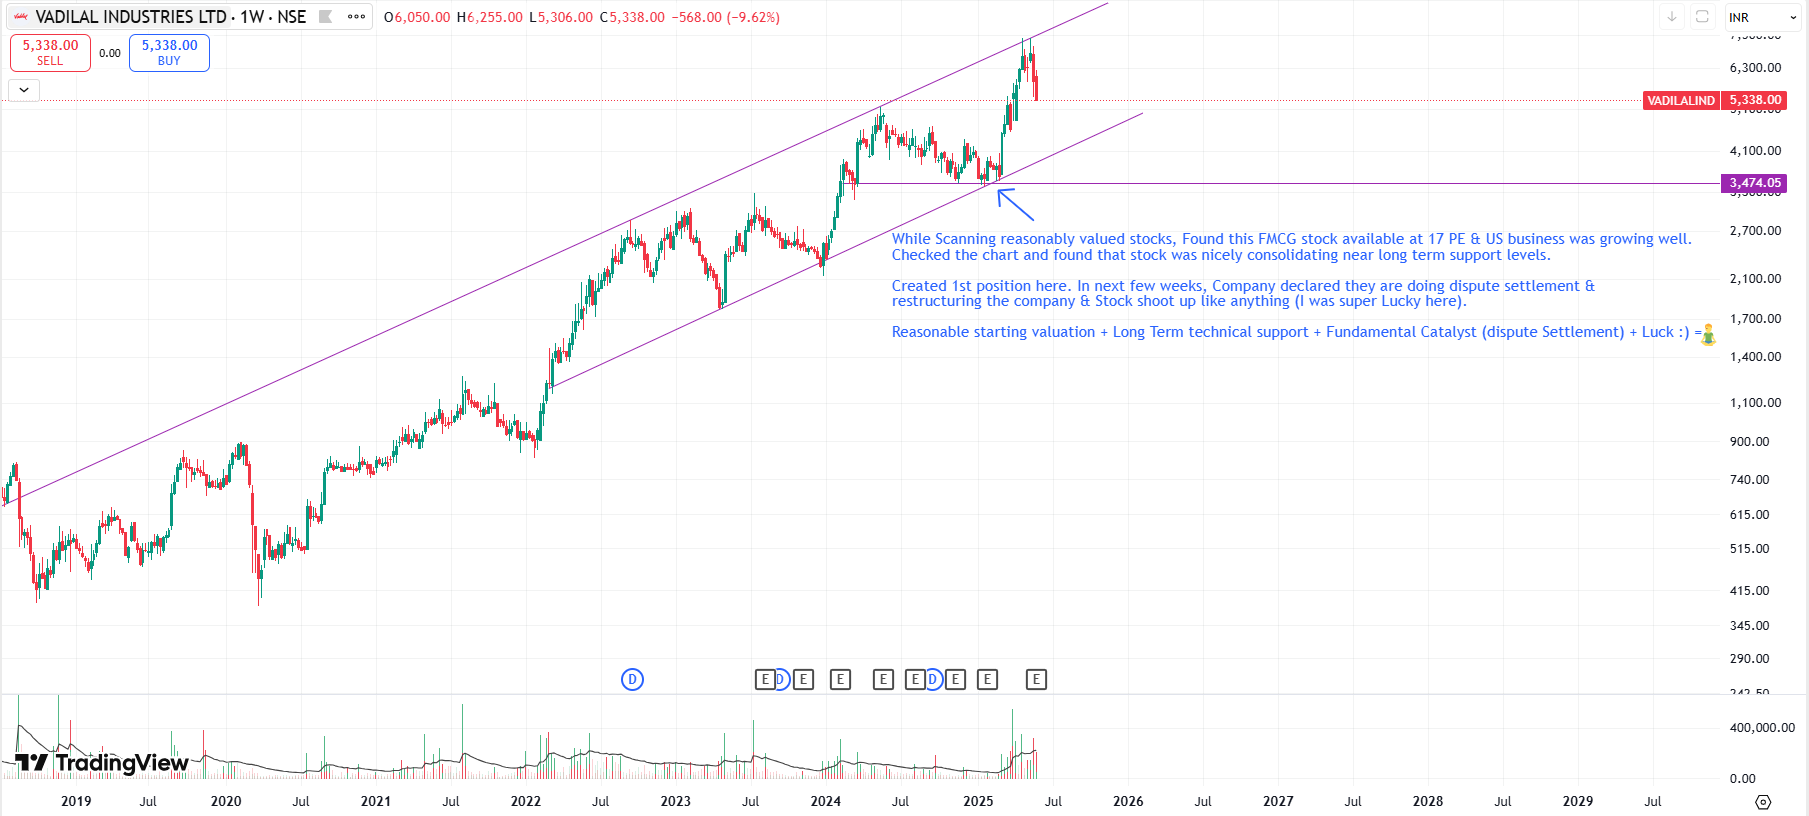
Vadilal Industries :
Venus Pipes :

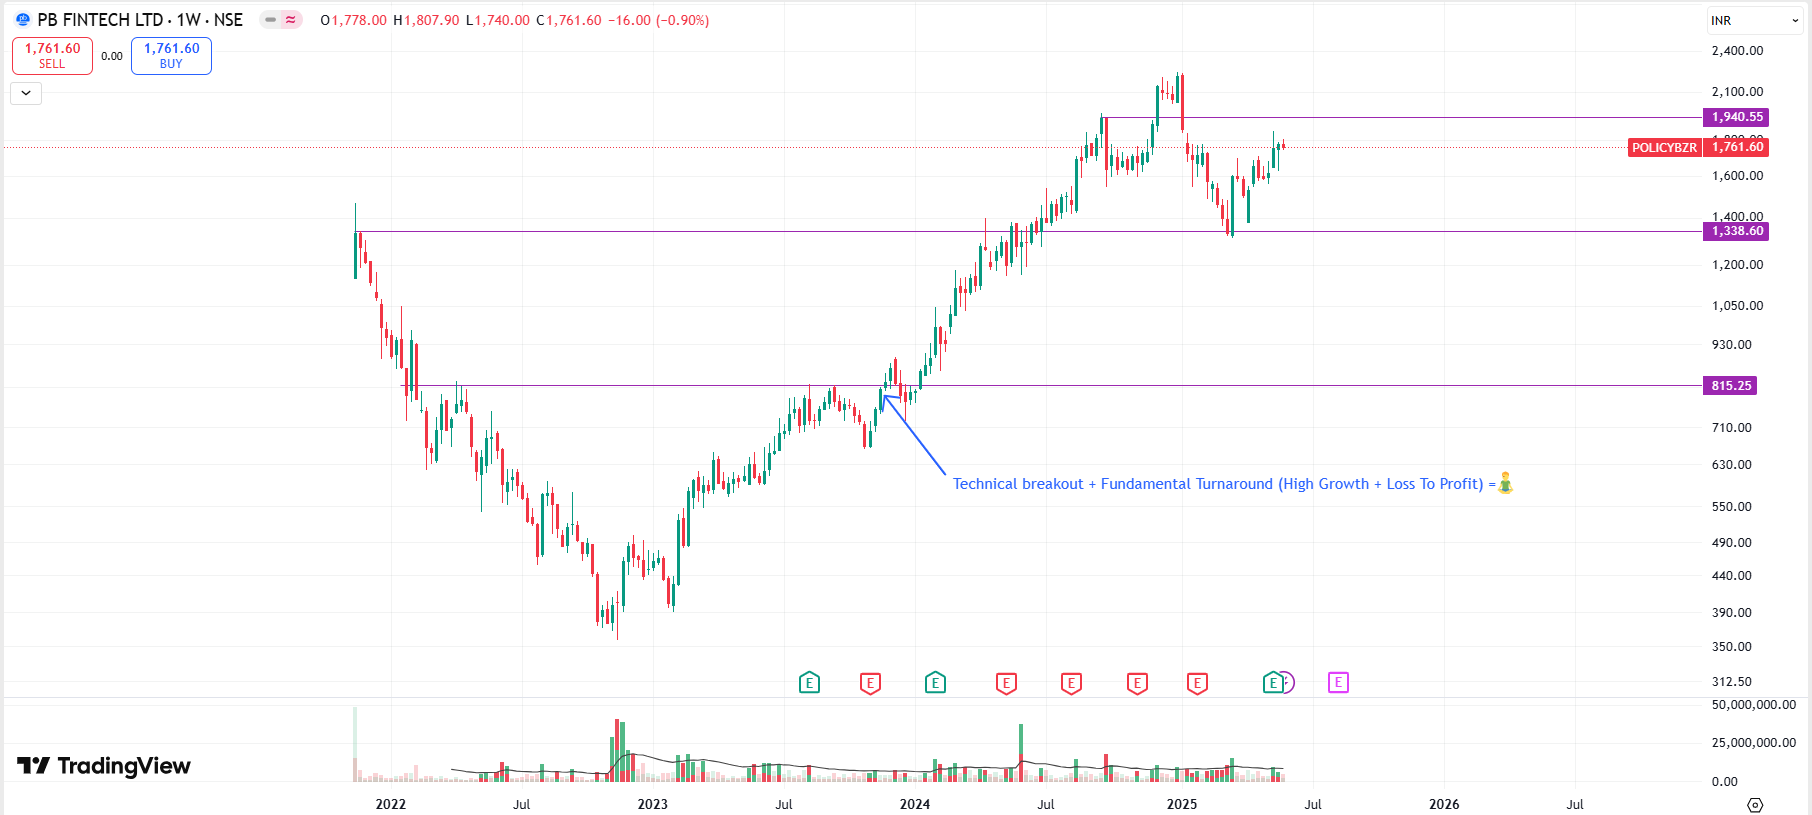
PB Fintech :
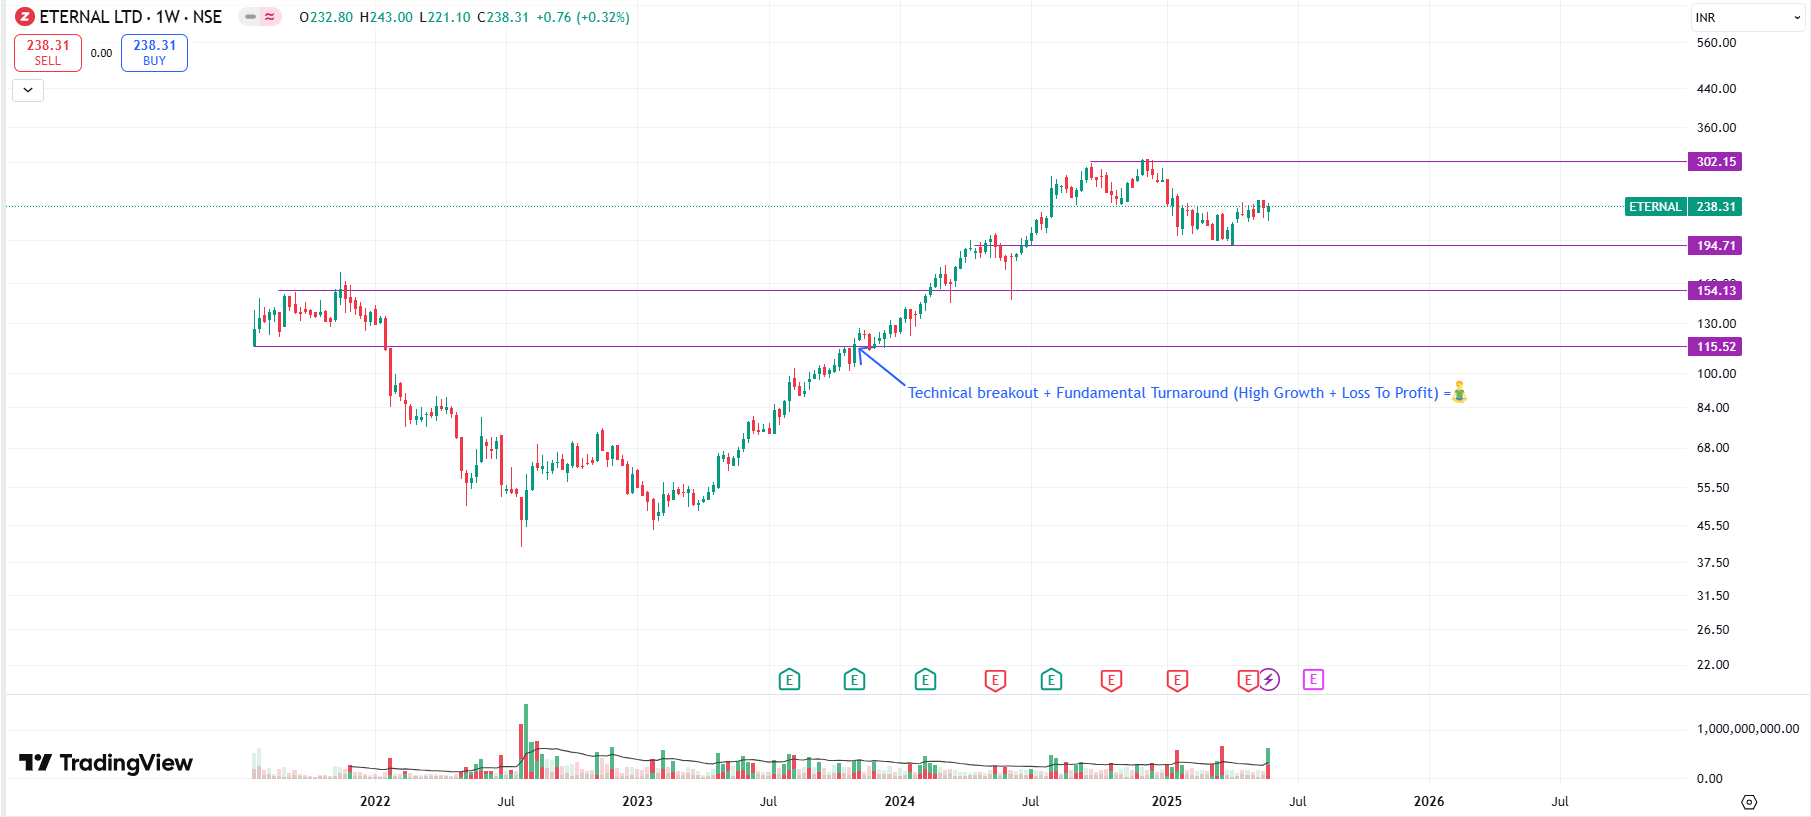
ZOMATO :
Navi NASDAQ 100 FOF :

Screening tools for finding all these Fundamental & Technical triggers :
While fundamental and technical analysis can each serve as powerful tools for analyzing sectors & stocks, combining these two methods can offer investors additional advantages. This combination allows investors to leverage the strengths of each method while covering their weaknesses.
The first advantage of integrating technical and fundamental analysis is the increased accuracy of predictions. For example, if fundamental analysis indicates that a company is undervalued and technical analysis shows that its price is at a strong support level, the investor can proceed to buy with greater confidence.
The second advantage is risk reduction. Fundamental analysis can help identify long-term risks, while technical analysis can provide early signals for price changes. Combining these two approaches allows investors to manage risk with more diverse and comprehensive strategies.
Ultimately, the combination of fundamental and technical analysis can enhance investment performance. By utilizing both methods, investors can take advantage of more opportunities and make better decisions regarding their portfolio management.
Fundamentals + Technicals = Your Swiss Army knife for investing !!!
Disclosure: I am not SEBI registered. The information provided here is for education purpose only. Hence, always check with your financial advisors before acting on any contents of this newsletter.
Thank You for feedback Tushar🤝
So clearly explained.. and very much useful to stay steady in the markets. 👍